Interpretable or Accurate? Why Not Both?
Building interpretable Boosting Models with IntepretML
The article was originally published here
 Image by Kingrise from Pixabay
As summed up by Miller, interpretability refers to the degree to which a human can understand the cause of a decision. A common notion in the machine learning community is that a trade-off exists between accuracy and interpretability. This means that the learning methods that are more accurate offer less interpretability and vice versa. However, of late, there has been a lot of emphasis on creating inherently interpretable models and doing away from their black box counterparts. In fact, Cynthia Rudin argues that explainable black boxes should be entirely avoided for high-stakes prediction applications that deeply impact human lives. So, the question is whether a model can have higher accuracy without compromising on the interpretability front?
Well, EBMs precisely tries to fill this void. EBMs, which stands for Explainable Boosting Machine, are models designed to have accuracy comparable to state-of-the-art machine learning methods like Random Forest and Boosted Trees while being highly intelligible and explainable.
This article will look at the idea behind EBMs and implement them for a Human Resources case study via InterpretML, a Unified Framework for Machine Learning Interpretability.
Machine learning Interpretability — A Primer
Machine Learning is a powerful tool and is being increasingly used in multi-faceted ways across several industries. The AI models are increasingly used to make decisions that affect people’s lives. Therefore, it becomes imperative that the predictions are fair and not biased or discriminating.
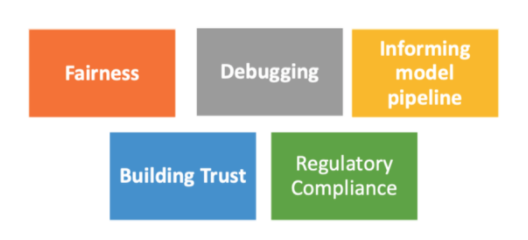
Advantages of having Machine learning Interpretability in pipeline
Machine learning interpretability has a vital role to play in such situations. Interpretability gives you the ability not only to discover a model’s mispredictions but analyze and fix the underlying cause too. Interpretability can help you debug your model, detect overfitting and data leakage, and most importantly, inspire trust between models and humans by giving explanations.
Interpretability Approaches
The approaches employed to explain the models’ predictions can be grouped into two major categories depending upon the type of machine learning models.
1. Glassbox Models vs. Blackbox explanations
Algorithms that are designed to be interpretable are called Glassbox models. These include algorithms like simple decision trees, rule lists, linear models, etc. Glassbox approaches typically provide exact or lossless explainability. This means it is possible to trace and reason about how any prediction is made. The interpretation of GlassBox models is Model-specific because each method is based on some specific model’s internals. For instance, the interpretation of weights in linear models count towards model-specific explanations.
Blackbox explainers, on the contrary, are model agnostic. They can be applied to any model, and such are post-hoc in nature since they are applied after the model has been trained. Blackbox explainers work by treating the model as a BlackBox and assume that they only have access to the model’s inputs and outputs. They are particularly useful for complex algorithms like boosted trees and deep neural nets. Blackbox explainers work by repeatedly perturbing the input and analyzing the resultant changes in the model output. The examples include SHAP, LIME, Partial Dependence Plots, etc., to name a few.
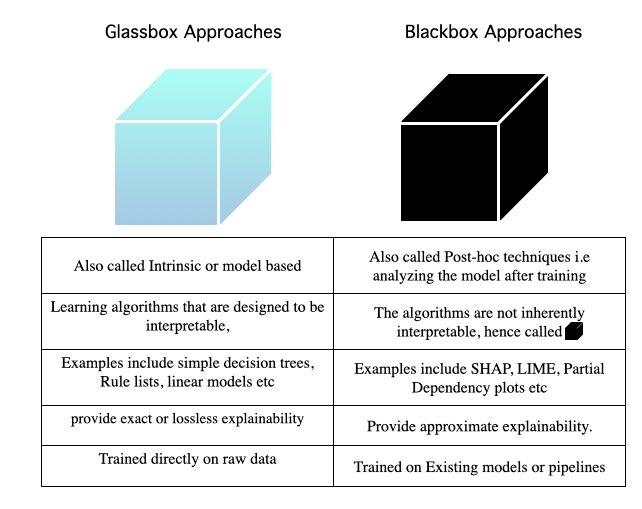
Glassbox vs. Blackbox explainability approaches
2. Local vs. Global explanations
Another category could be depending upon the scope of explanations. Local explanations aim to explain individual predictions, while global explanations explain the entire model behavior.
Now that we have sufficient intuition into the interpretability mechanism employed by machine learning models, let’s switch gears and understand EBMs in more detail.
Explainable Boosting Machine (EBMs)
EBMs are Glassbox models designed to have accuracy comparable to state-of-the-art machine learning methods without compromising accuracy and explainability
EBM is a type of generalized additive model or GAM for short. Linear models assume a linear relationship between the response and predictors. Thus, they are unable to capture the non-linearities in the data.
Linear Model: y = β0 + β1x1 + β2x2 + … + βn xn
To overcome this shortcoming, in the late 80’s statisticians Hastie & Tibshirani developed generalized additive models(GAMs), which keep the additive structure, and therefore the interpretability of the linear models. Thus, the linear relationship between the response and predictor variable gets replaced by several non-linear smooth functions(f1, f2, etc.) to model and capture the non-linearities in the data. GAMs are more accurate than simple linear models, and since they do not contain any interactions between features, users can also easily interpret them.
Additive Model: y = f1(x1) + f2(x2) + … + fn(xn)
EBMs are an improvement on the GAMs utilizing techniques like gradient boosting and bagging. EBMs include pairwise interaction terms, which increases their accuracy even further.
EBMs: y = Ʃifi (xi) + Ʃijfij(xi , xj) + Ʃijk fijk (xi , xj , xk )
The following talk from Richard Caruana, the creator of EBM, goes deeper into the intuition behind the algorithm.
The vital point to note here is that even after all these improvements, EBM still preserves the interpretability of a linear model but often matches the accuracy of powerful BlackBox models, as shown below:
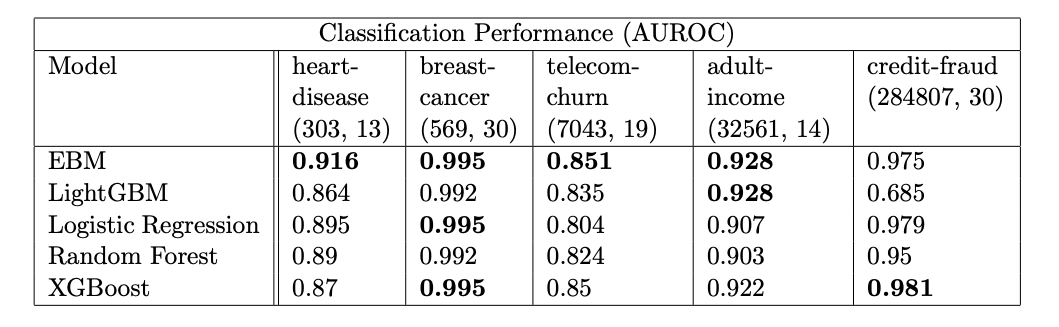
Classification performance for models across datasets (rows, columns)|Source : InterpretML: A Unified Framework for Machine Learning Interpretability
Case Study: Predicting Employee Attrition Using Machine Learning
Here is the nbviewer link to the code notebook in case you want to follow along.
](https://cdn-images-1.medium.com/max/3840/1*289fHah3E3BX9CkKrIJegw.jpeg) Andrew Martin from Pixabay
Andrew Martin from Pixabay
It’s time to get our hands dirty. In this section, we’ll train an EBM model to predict employee attrition. We’ll also compare the performance of EBMs with other algorithms. Finally, we’ll try and explain the predictions that our model made with the help of a tool called InterpretML. What is interpretML? Let’s find out.
IntepretML: A Unified Framework for Machine Learning Interpretability
EBMs come packaged within a Machine Learning Interpretability toolkit called InterpretML. It is an open-source package for training interpretable models as well as explaining black-box systems. Within InterpretML, the explainability algorithms are organized into two major sections, i.e., Glassbox models and Blackbox explanations. This means that this tool can not only explain the decisions of inherently interpretable models but also provide possible reasoning for black-box models. The following code architecture from the official paper sums it nicely.
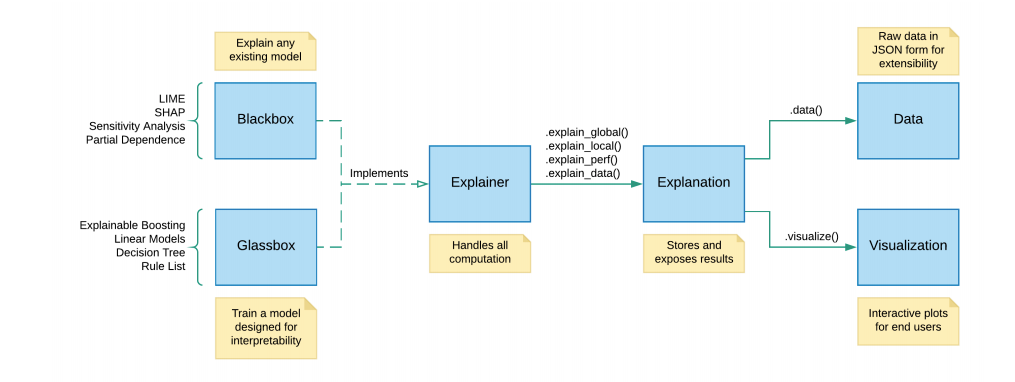 code architecture from the official paper | Source: InterpretML: A Unified Framework for Machine Learning Interpretability
As per the authors, InterpretML follows four fundamental design principles:
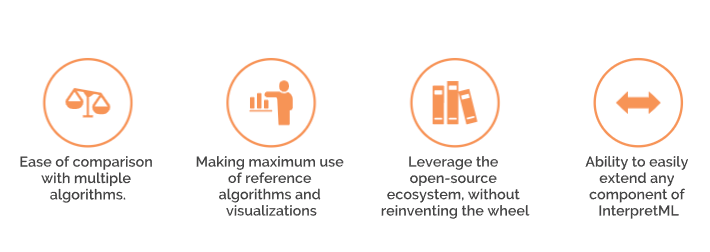
InterpretML’s also offers an interactive visualization dashboard. The dashboard provides valuable insights about the nature of the dataset, model performance, and model explanations.
Dataset
We’ll use the publicly available IBM HR Analytics Employee Attrition & Performance dataset. This dataset contains data about an employee’s age, department, gender, education level, etc., along with information on whether the employee left the company or not, denoted by the variable Attrition. “No” represents an employee that did not leave the company, and “Yes” means an employee who left the company. We will use the dataset to build a classification model to predict the employees’ probability of attrition.
Here’s a snapshot of the dataset features.
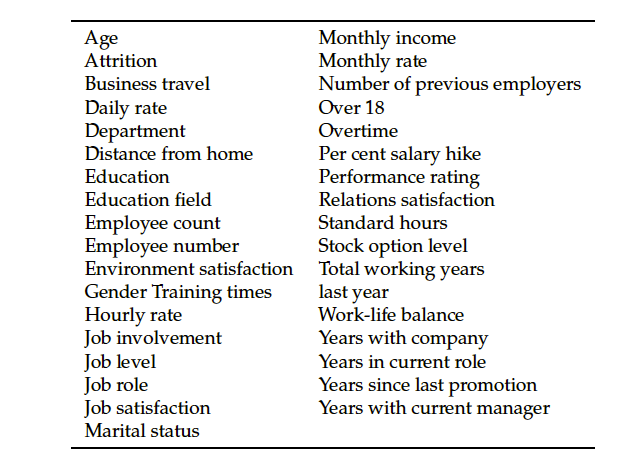
Features of the dataset
As stated above, InterpretML supports training interpretable models (glass-box), as well as explaining existing ML pipelines (**Blackbox **), and is supported across Windows, Mac, and Linux. Currently, the following algorithms are supported in the package:
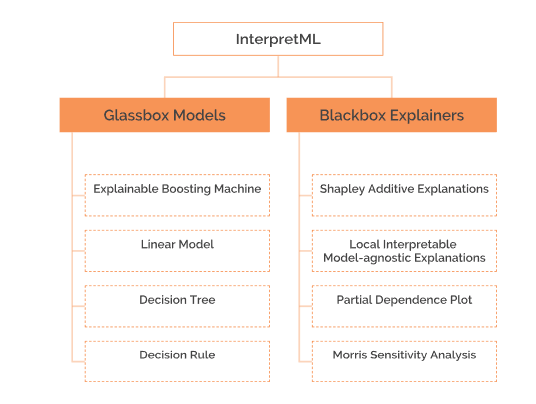
Algorithms supported by InterpretML
Exploring the dataset
The first task is always to explore the dataset and understand the distributions of various columns. InterpretML provides histogram visualizations for classification problems.
hist = ClassHistogram().explain_data(X_train, y_train, name = 'Train Data')
show(hist)
 Histogram visualization
Training the model
Training an EBM is relatively easy with InterpretML. After preprocessing our dataset and splitting it into training and a test set, the following lines of code get the job done. InterpretML conforms to the familiar scikit learn API.
ebm = ExplainableBoostingClassifier(random_state=seed, n_jobs=-1,inner_bags=100,outer_bags=100)
ebm.fit(X_train, y_train)
Once the model is trained, we can visualize and understand the model’s behavior globally and locally.
Global Explanations
Global Explanations help better understand the model’s overall behavior and the general model behavior across the population.
ebm_global = ebm.explain_global(name='EBM')
show(ebm_global)
The first graph that we see is the Summary plot which states that the Overtime variable is the most critical feature in determining if someone will leave the company or not.
 Viewing Global Explanations
We can also look deeper into each feature plot on drilling down.
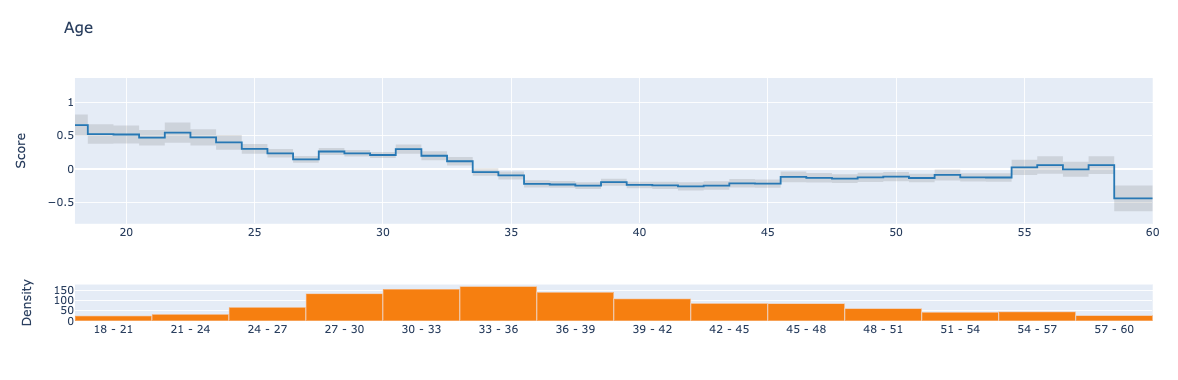 Effect of age on attrition
The score here refers to the logit since the problem is a classification one. The higher you are on the y-axis, the higher your odds of leaving the company. However, after around 35 years of age, this behavior changes, and you have more chances of staying back.
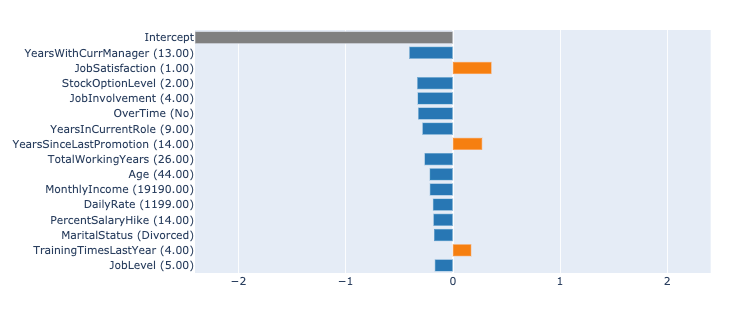
Local Explanations
Local Explanations help us understand the reasons behind individual predictions and why a particular prediction was made.
ebm_local = ebm.explain_local(X_test[:5], y_test[:5], name='EBM')
show(ebm_local)
Comparing the performance with other models
It is also easy to compare the performance of different algorithms and display the results in a dashboard format.
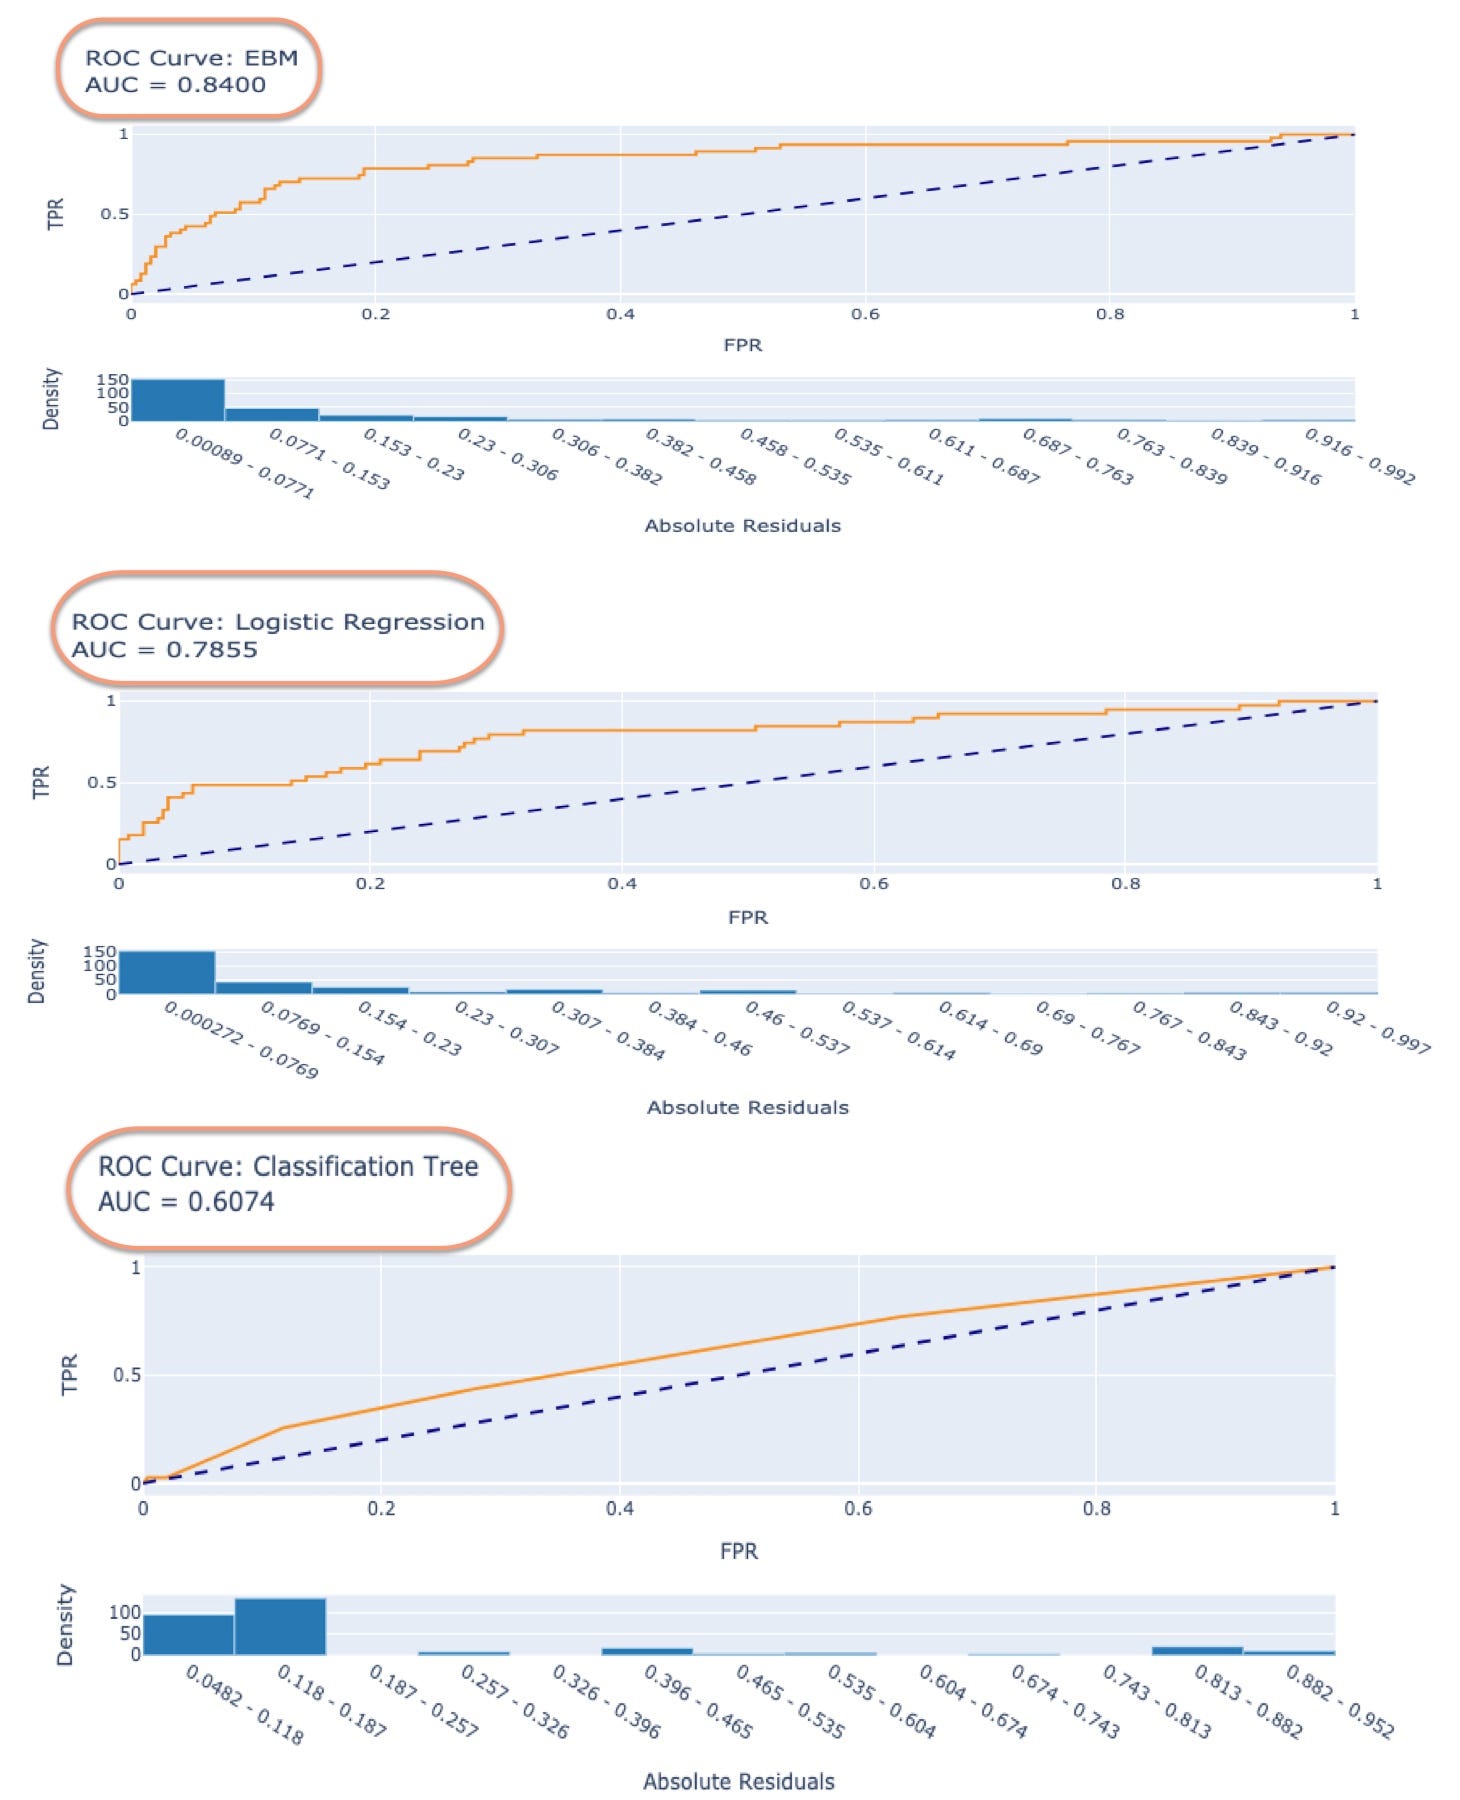 Comparison Dashboard
Training BlackBox models
Comparison Dashboard
Training BlackBox models
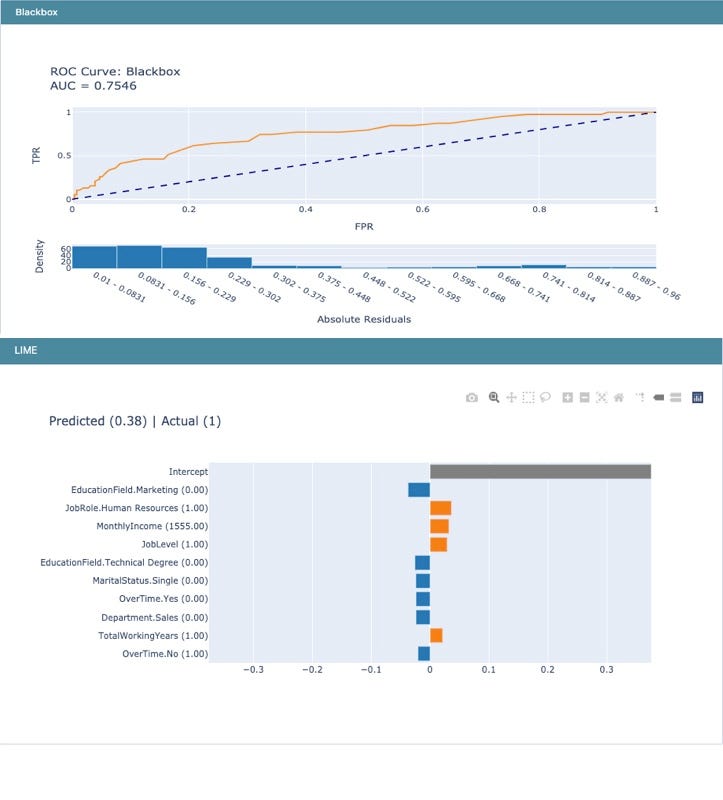
If required, InterpretML can also train BlackBox models and provide explanations for the predictions. Here is an example of a trained Random ForestClassifier model on the same dataset and the subsequent explanation provided by LIME.
Conclusion
This article showcased how EBMs emerge as an excellent choice for creating both interpretable and accurate models. Personally, when machine learning models are used in high-stakes decisions, interpretability should be given a higher preference over a loss of few points of accuracy. It is not only important to see if a model works, but we as machine learning practitioners should also care about how it works and whether it works without any intentional bias.
References
A lot of sources and papers were referenced for this article which have been linked in the article. The primary source, however, was the official paper of InterpretML and its documentation.